Sheet # 840
Use the following chart to answer questions 1-3.
FAVORITE PETS OF 3RD GRADERS

1. How many more third graders liked dogs for a pet than fish?
a. 15
b. 20
c. 13
d. 41
2. How many students voted for dogs and cats to be their favorite pet?
a. 45
b. 25
c. 34
d. 44
3. How many students voted in third grade?
a. 55
b. 65
c. 56
d. 66
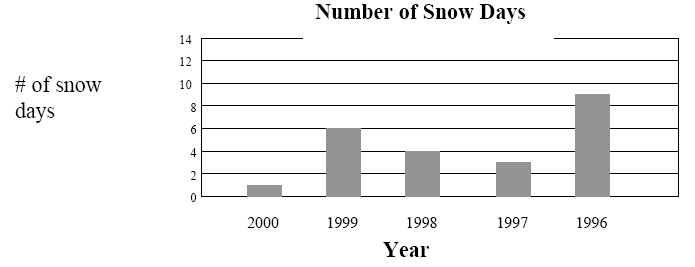
Use the following graph to answer questions 4-8.

4. Which two years had the fewest number of snow days?
a. 2000 and 1998
b. 2000 and 1996
c. 2000 and1997
d. 1999 and 1996
5. According to the graph, which year did it probably snow the most?
a. 1999
b. 1996
c. 2000
d. 1998
6. How many more snow days did students have in 1999 than in 2000?
a. 5
b. 6
c. 1
d. 4
7. Which year had 3 fewer snow days than 1996?
a. 1998
b. 1997
c. 2000
d. 1999
8. How many total snow days were recorded on this graph?
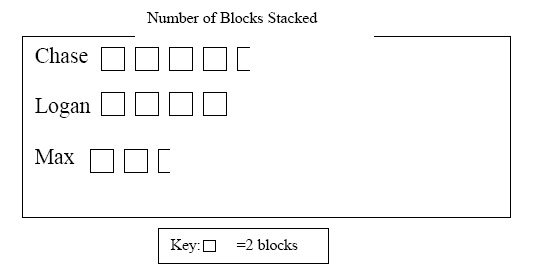
Use the following pictograph to answer questions 9-12.
This pictograph shows the number of blocks stacked by the toddlers.

9. Which toddler was able to stack the most blocks?
a. Logan
b. Chase
c. Max
10. How many blocks were stacked in all?
a. 20
b. 24
c. 22
d. 11
11. How many more blocks did Chase stack than Max?
a. 4
b. 7
c. 8
d. 3
12. How many blocks did Logan and Max stack together?
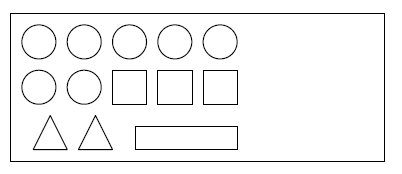
13. If these shapes were in a brown bag, without looking you choose a shape. Which shape would you most likely choose?

a. square
b. circle
c. triangle
d. rectangle
14. There are 4 red blocks, 2 blue blocks, 8 green blocks, and 1 yellow block in a bag. Which color block would you be most likely to pick out of the bag?
a. red
b. blue
c. yellow
d. green
15. What combination of shapes do you predict will come next?