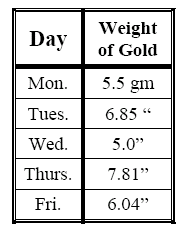
6. Prospector Pete has been panning for gold. This chart shows his results for the week. What is the mean amount of gold he has found during this week?
Sheet # 849
D. 92
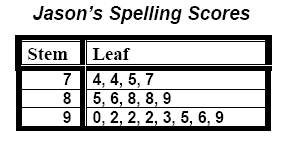
2. What is the mode of Jason's spelling scores?
3. What is the range of Jason's scores?
D. 5
4. Eric fished on three different days last week. His catches were 2 1/2 pounds, 4 pounds, and 3 1/4 pounds. Find the mean of the amount of fish he caught.
D. 9 3/4 pounds
5. On a bar graph, the scale shows multiples of 100. You see a bar that is 3/4 of the distance between 800 and 900. What amount is that?
D. 875
6. Prospector Pete has been panning for gold. This chart shows his results for the week. What is the mean amount of gold he has found during this week?

D. 31.2 gm
7. What is the median amount of gold that Prospector Pete found?
D. 6.85 gm
8. What can you say about the number of hours Brandon sleeps by looking at this data?
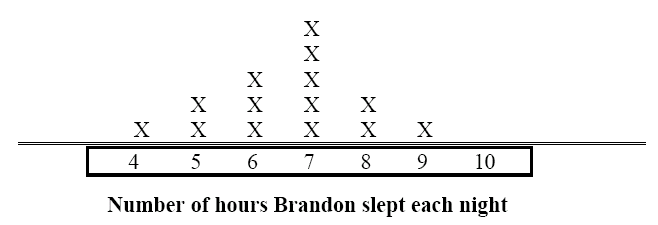
Number of hours Brandon slept each night
B. Most people sleep an average of 8 hours nightly.
C. Brandon is most likely to average 8 hours or less of sleep each night.
D. Brandon should get more sleep.
9. Using the information given, how many nights in the next two-week period would you predict that Brandon would get 8 or more hours of sleep?
D. 10 to 12 nights
10. Ashley's mom is on a diet. Which graph would be best to show her progress over a period of six months?
D. Stem and leaf plot
11. Karen is making a cake. She has several choices: chocolate, angel food, yellow cake, and lazy daisy cake. In addition, she has vanilla, chocolate, and butterscotch frostings. How many different combinations of cake and frosting can she make?
D. 16 different combinations
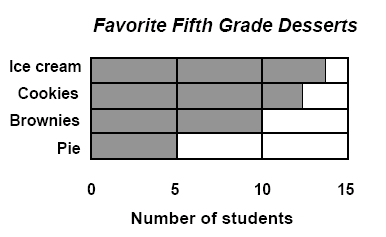
12. The fifth grade surveyed their class on their favorite desserts with the following results. How many students are in the fifth grade, based on this graph?
D. 41 students
13. Based on their results, what could you expect would be the least favorite dessert if they surveyed the junior high on this same question?
D. Ice cream
14. Misha is making a circle graph to show a typical day in her life. If she sleeps 8 hours each day and is at school for 8 hours, how much of the graph will be left to show what she does on the rest of her day?
D. 1/6 of the graph
15. The students in fifth grade surveyed student about their favorite lunch. What conclusions could you draw from these results?
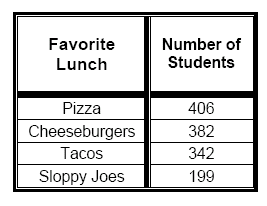
A. Sloppy joes were only about half as popular as pizza.
B. Pizza is healthier to eat than sloppy joes.
C. Tacos are the best seller.
D. Pizza and cheeseburgers together got nearly the same number of votes as cheeseburgers and tacos did.
16. If you were labeling this pie graph with the following information, in which section would you put fast food?
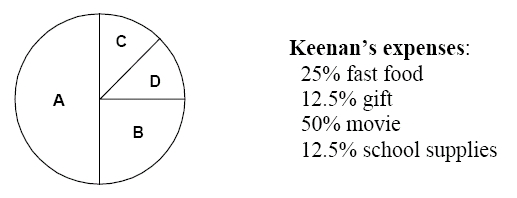
D. the D section
17. Look at the pictograph below. If you purchased 3-dozen apples, how many would be left after giving each student an apple?
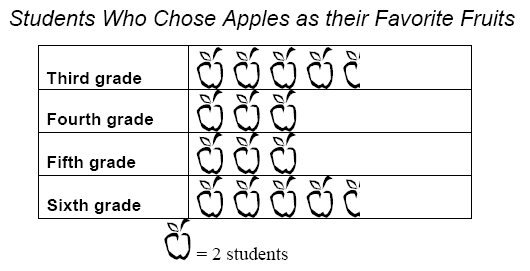
D. 21 apples
18. Which graph would be the best choice to compare the populations of the states in the Middle West region?
D. circle graph
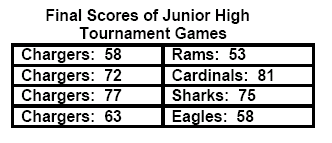
19. What percent of their tournament games did the Chargers win?
